SAP BusinessObjects Business Intelligence (SAP BO BI)
Make better, more informed decisions with access to real-time insights on a single, scalable platform.
SAP BusinessObjects Business Intelligence
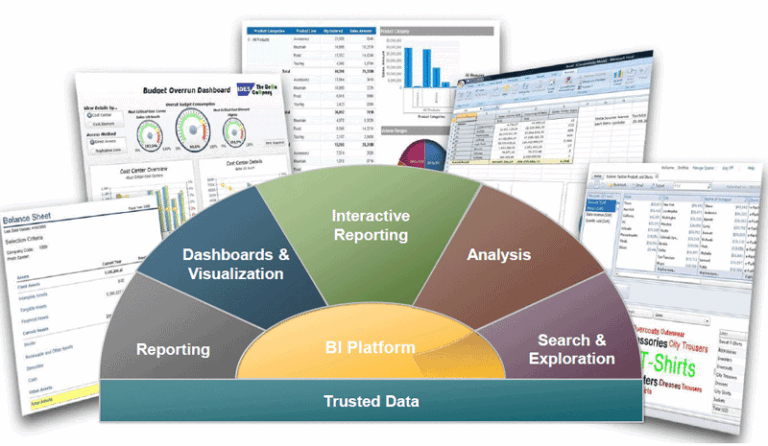
SAP BusinessObjects Business Intelligence, also known as BO, BOBJ and BOBI, is a centralised suite for data reporting, visualisation, and sharing. As the on-premise BI layer for SAP’s Business Technology Platform, it transforms data into useful insights, available anytime, anywhere.
- Provide performance management, reporting, dash boarding query & analysis, and enterprise information management
- It can be divided into 3 main use cases:
- Discovery and Analysis
- Dashboards and applications
- Reporting
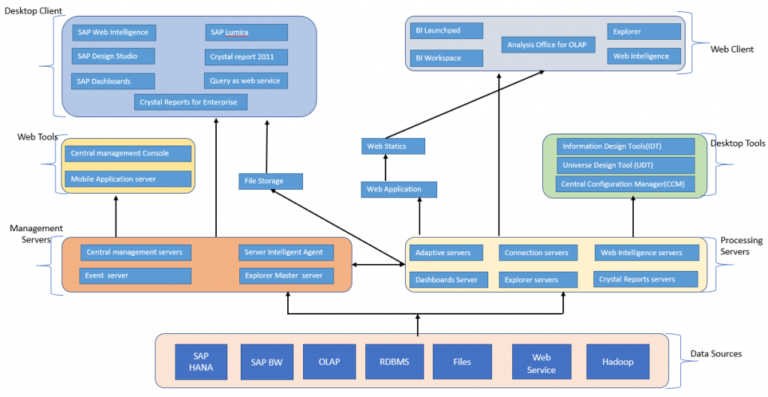
- Prerequisite: SAP BW/ HANA/ RDBMS/ OLAP/ Hadoop/ Web Services/ Files etc.

Share insights and make better decisions with the SAP BusinessObjects Business Intelligence (BI) suite. By providing a flexible architecture, our analytics platform can support your growth – from a few users to tens of thousands of users, and from a single tool to multiple tools and interfaces.
- On-premise deployment
- Real-time business intelligence
- Increased user autonomy
- Simplified, personalised, and dynamic information consumption
SAP Business Objects - Tools
- Discovery and Analysis :
- SAP Lumira
- SAP BO Explorer
- SAP BO Analysis
- Dashboards and applications :Powerful environment to build interactive and visually appealing analytics (use custom code)
- SAP BusinessObjects Dashboards (Xcelsius)
- SAP BusinessObjects Design Studio
- Reporting : Quickly build formatted reports on any data source
- SAP Crystal Reports
- SAP BusinessObjects Web Intelligence
- SAP IDT (Information design tool) – Semantic Layer
- SAP Admin – CMC (Central Management Console)
- SAP BO – BI Launchpad
- SAP Roam BI – Cloud based self-service tools for mobile analytics

Key Functionalities – SAP BO BI
- Enterprise reporting –Bring together data from several sources, create any type of report, and Schedule and share reports/dashboards online securely, inside or outside the organization
- Ad hoc query and analysis –Enable users to ask a question, receive an answer, and ask more questions based on report results
- Data visualization –Enable users to monitor trends and variances, identify root causes, and model scenarios
- Data integration and quality –Consolidate and cleanse data across multiple sources to ensure complete, accurate, and trusted information for decision making.
- Preconfigured, customizable templates: Create interactive visualizations, data sets, charts, and graphs
- Security: Use folder-level security to limit access and help ensure data security
BENEFITS
Low cost
Functionality available in a concurrent-access license model
Fast deployment
Common installation, security, and metadata as well as prebuilt solutions and packages
Strong governance
Data-level security, impact analysis, and data lineage
High productivity
Alerts, guided navigation, a patented semantic layer, and intuitive interfaces
Great agility
Clear visibility into business processes, business partners, and financial performance
Talk To Our Consultant
You are more than welcome to contact our Partnership Manager for a free consultation.
Don't hesitate to contact us
(+84) 888 780 670